MyTube
Channel analytics and publishing control for YouTube — what the numbers actually say, and a plan for what ships next.
The problem. A channel’s own dashboard tells you what happened; it does not tell you what to do on Tuesday. The numbers that matter are comparative and cumulative: which format holds, which opening dies, what the last ten releases did to retention. They live behind a click path nobody walks daily.
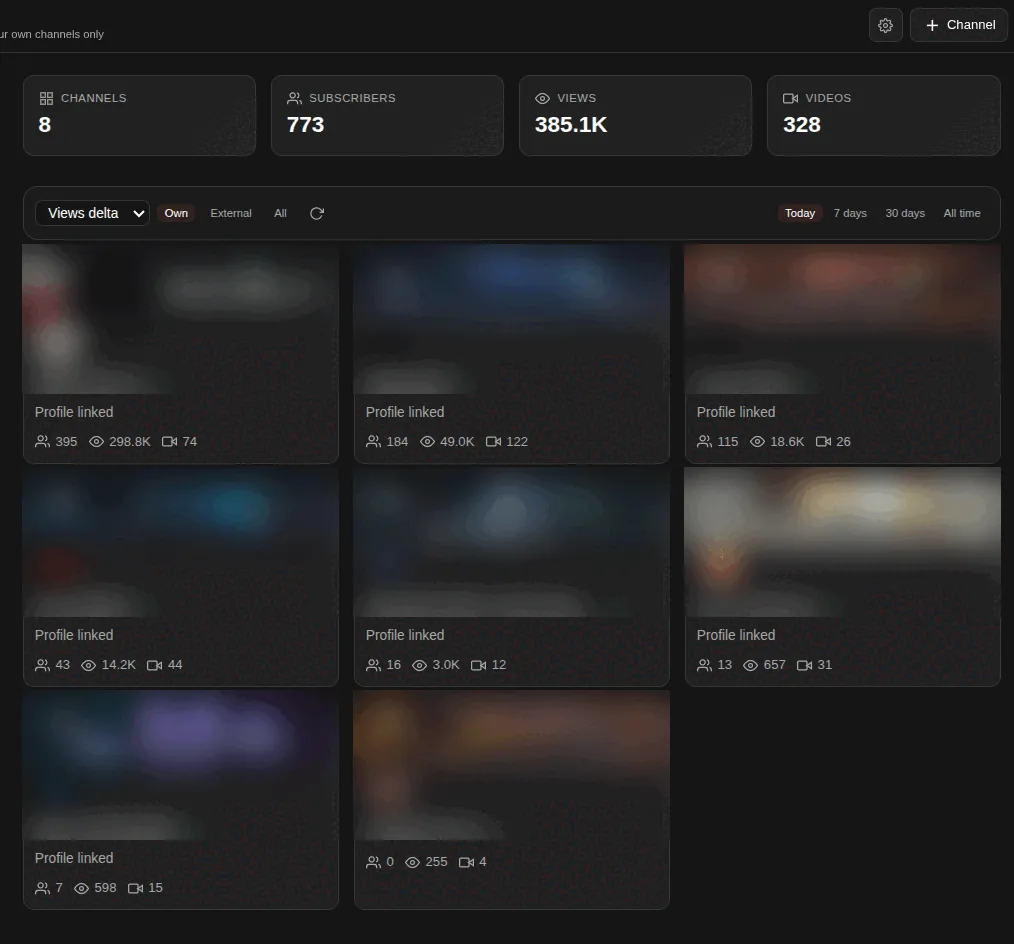
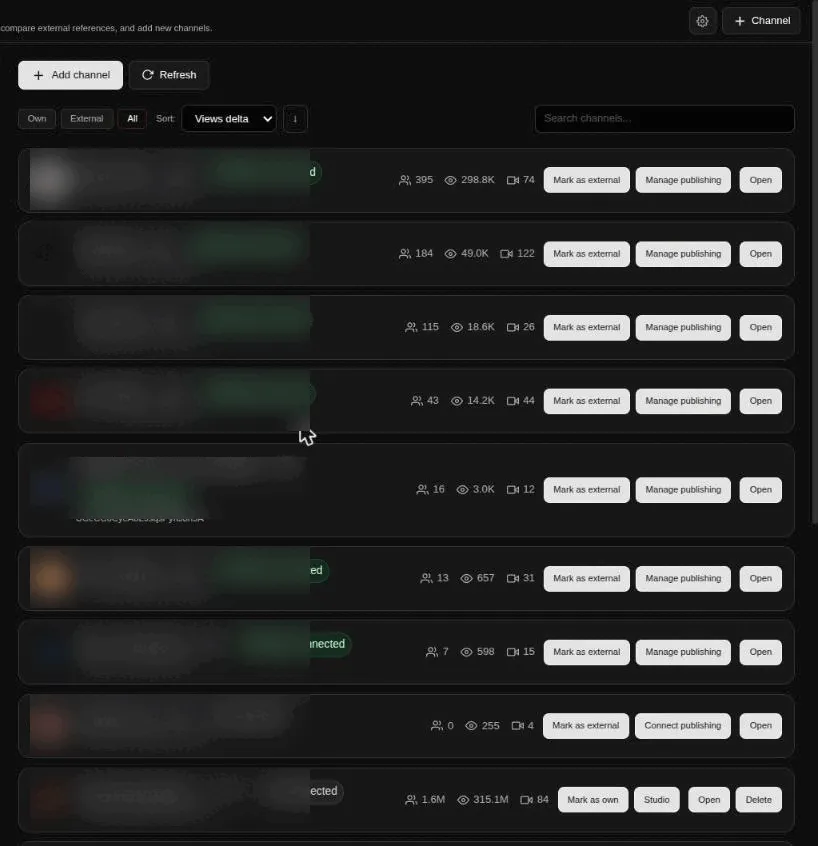
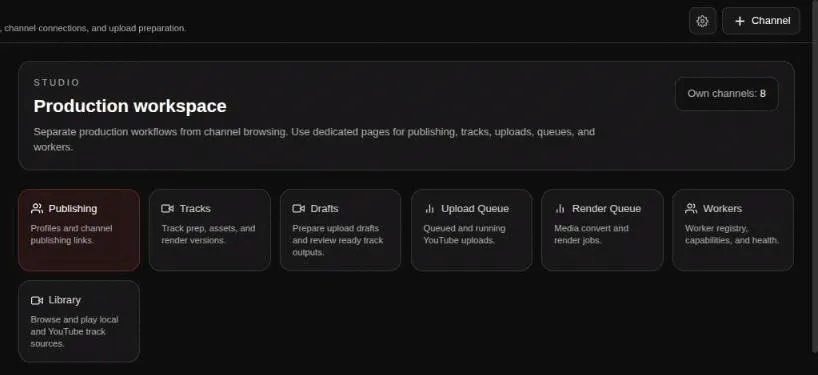
What runs. Statistics and analytics across channels in one place, alongside the planning side: what is scheduled, what is queued, what shipped and when. The publishing rhythm and the evidence for it sit on the same surface, which is the only arrangement in which the evidence changes the rhythm. Eight channels run through it today: 773 subscribers, 385,000 views, 328 videos, and an upload log that tracks the API quota each publish spends.
Designed next. Feeding the analysis straight into the scheduled pipeline that already publishes — so a format that measurably works becomes the next release’s default rather than a note somebody remembers.
The transferable part. Measurement earns its keep only where the decision is made. An analytics product separated from the publishing control is a report; joined to it, it is a policy.